View builds
From the Builds page, you can inspect past builds and monitor the progress of ongoing builds.
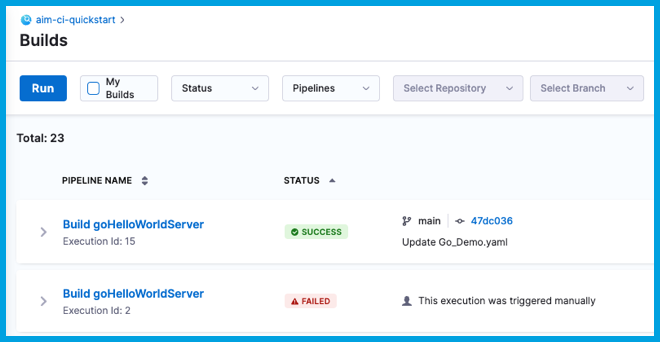
The Builds page provides the following information about current and past builds:
- Pipeline Name: The name of the pipeline that ran and the build number (Execution Id). Select the pipeline name to go to the Build details page.
- Status: The build status, such as running, failed, or success.
- Trigger: How the build started, whether by a webhook trigger or manually. Builds triggered by webhooks can include source code repository links.
- Executed By: The name of the user that started the build.
- Runtime: How long the build ran.
Build details
On the Build details page, you can investigate a variety of details about a specific build.
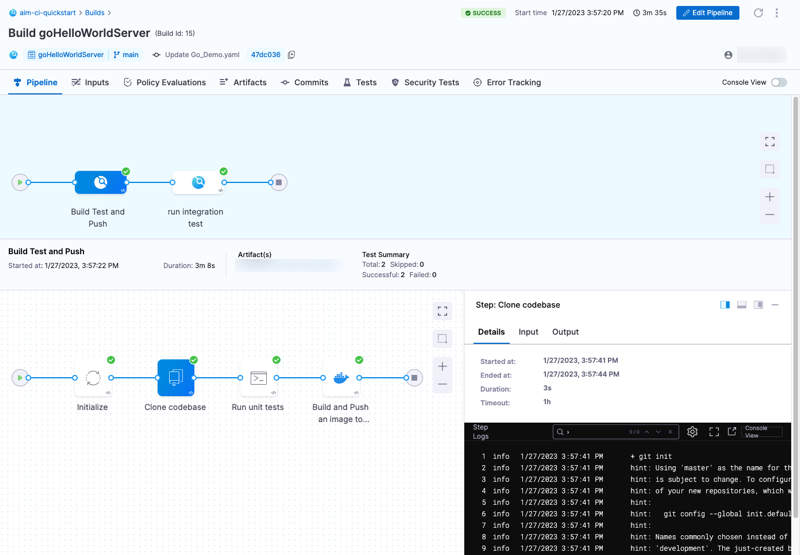
Pipeline tab (logs)
This tab shows the build stages and steps.
Select a step to investigate logs, inputs, outputs, and errors (if any) for that steps. If enabled, AIDA can provide troubleshooting assistance.
When troubleshooting failed builds, you can switch to Console View to allocate more screen space to logs. Once you've identified a potential cause, select Edit Pipeline to go directly to the Pipeline Studio.
Logs are limited to 5MB, if you need to examine logs larger than 5MB, you need to export full logs.
Inputs tab
This tab lists pipeline-level inputs. Step-level inputs are reported in the step details on the Pipeline tab.
Artifacts tab
This tab provides links to artifacts, such as images or reports, produced during the build.
Availability of artifact details depends on the upload location, build configuration, or build infrastructure. For an example and more information, go to View tests - View reports on the Artifacts tab.
Commits tab
This tab provides a list of commits that triggered the build, along with source code repo links, if applicable.
Tests tab
This tab presents test results from Run or Run Tests steps. For more information, go to View tests.
Other tabs
The Policy Evaluations, Security Tests, and Error Tracking tabs report Error Tracking information and information from other Harness modules and features, such as Harness Policy As Code, if these are enabled and included in the pipeline.
Source code repository links
Builds triggered by webhooks can include a link to the PR or commit that started the build.
![]()
Similarly, for manual and automated pull request builds, you can follow the Details link from the PR's Git status to the build details page in Harness. This functionality is not supported for all SCM providers.
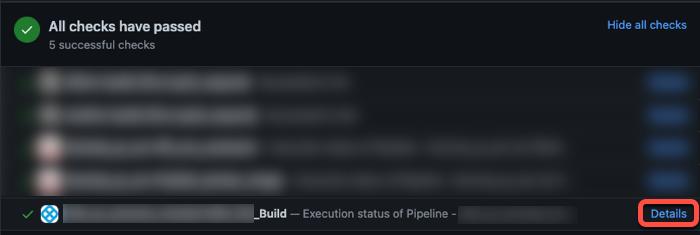
Harness uses the pipeline's codebase connector to send status updates to PRs in your Git provider. If status updates aren't being sent, check the pipeline's codebase configuration to confirm that it has a default codebase configuration and that it is using the correct code repo connector.
Dashboards
For information about Harness dashboards, go to the Platform documentation on Dashboards.
Error Tracking (Run Tests step)
If you enabled error tracking in the Run Tests step, a list of code error events are reported on the Error Tracking tab. For each event, the following are reported:
- Event Type and Description.
- Location in the code.
- Impact (Count) in terms of volume and spread across your application.

The following event types are reported:
- Caught Exception: Exceptions that were captured and resolved by the application.
- Uncaught Exception: Exceptions that were not captured by the application.
- Swallowed Exception: Exceptions that were captured but ignored by the application.
- Log Error: Events logged as errors in the application.
- Log Warnings: Events logged as warnings in the application.
- HTTP Errors: HTTP communication errors.
Select the event's Location to open the Automated Root Cause Analysis (ARC) page where you can view the source code, stack, variable state, and log statements leading to the error. This helps you analyze, troubleshoot, and remediate errors faster.
